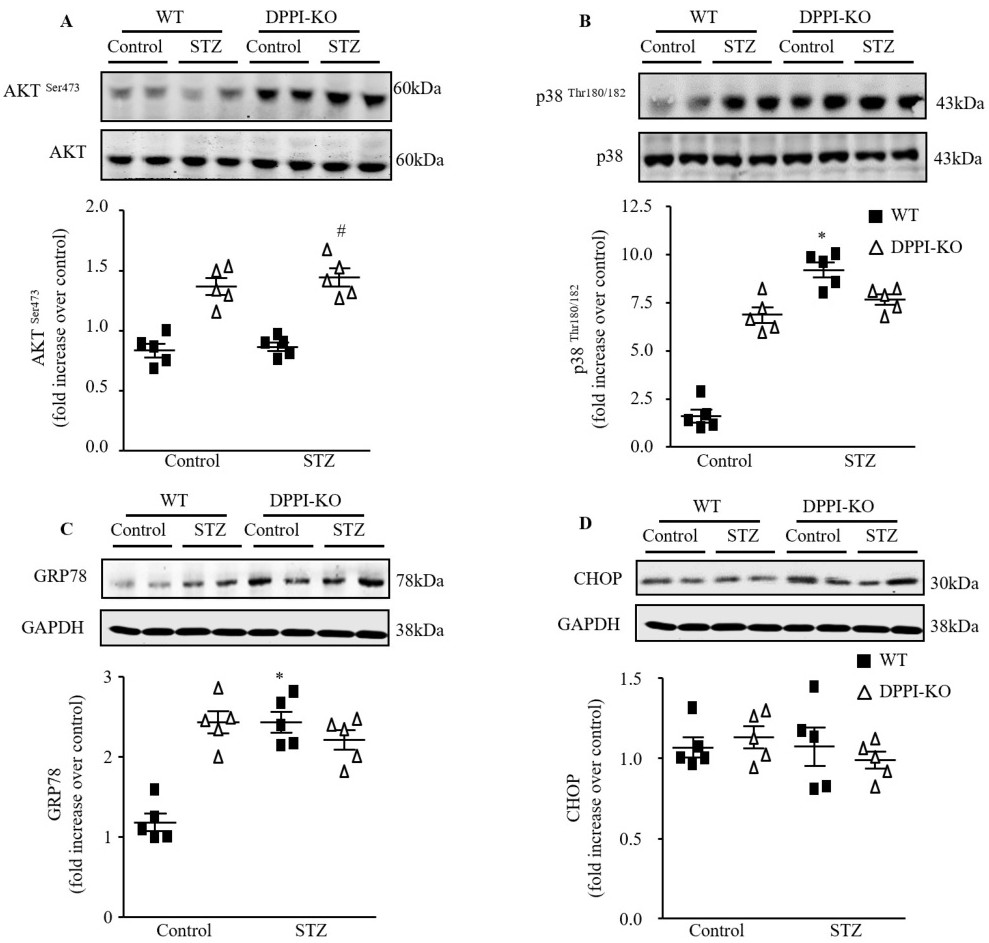
Fig. 7. Signal transduction mechanisms involved in the induction of apoptosis by inflammatory serine protease. (A) Representative Immunoblots of LV lysates from control and diabetic WT or DPPI-KO animals. (A) Top, Immunoblots analysis of phosphor-AKTSer473, (B) phopsho-p38hr180/182, (C) GRP78, and (D) CHOP expression in the LV heart tissue. Botton, Quantification of the experiments represented as fold change compared to WT animals Data are expressed as means ± SEM (n=5).*=p< 0.05 vs control and #=p<0.05 vs STZ-treated WT. One-way ANOVA followed by the Tukey post hoc test was used to compare multiple groups.